Welcome to Laser Pointer Forums - discuss green laser pointers, blue laser pointers, and all types of lasers

LPF Donation via Stripe | LPF Donation - Other Methods

Links below open in new window

ArcticMyst Security by Avery

8X Diode Murder fund

Joined
Aug 13, 2008
Messages
361
Points
0
What Kenom is saying is that while 60 seconds on and 60 seconds off is just fine a much better torture test would be 10 seconds on, 10 seconds off. That's still a 50% duty cycle.

You would still rack up the hours nearly as fast but it would subject the diode to a hell of a lot more "on" cycles which may be what kills diodes faster.


daguin

0
Joined
Mar 29, 2008
Messages
15,989
Points
113
What Kenom is saying is that while 60 seconds on and 60 seconds off is just fine a much better torture test would be 10 seconds on, 10 seconds off. That's still a 50% duty cycle.

You would still rack up the hours nearly as fast but it would subject the diode to a hell of a lot more "on" cycles which may be what kills diodes faster.

Ten second burns are not very realistic when trying to simulate actual usage. Originally, we went with "constant on" longevity tests. Through discussion we decided that we needed to more closely simulate a consumer's use. Also through discussion the "one minute" burn most closely simulated actual burn time in the hands of users.

I'm sure that somebody only burns their violet for 10 seconds at a time, but that would not be "normal."

100 hours of on time at 60 on 60 off is 3000, one minute burns. That is eight one minute burns every day for a year.

Granted 60 on and 60 off "continuously" also is not realistic. It is just the best we can do and still finish a test more than once a year. ;)

Peace,
dave
 
Last edited:

Kenom

0
Joined
May 4, 2007
Messages
5,629
Points
63
Ahh gotcha. Well I was unaware of the on/off cycles in this test. I agree that 60 seconds is pretty much an accurate representation of average on time for our lasers.
 
Joined
Dec 1, 2008
Messages
271
Points
0
Igor;

This is a graph from Nichia on 320mw 12X BR diodes:
fig6.jpg

The graph on the right shows very little aging differences in BR diodes with various efficiencies.

I think a 10% increase in current would be a good level for the next 8X test,
which would be 330/250 or 167% of rated peak current.

LarryDFW

If my math is correct, then running this at 1.67 x its rated pulse power of 320ma would give ~ 568mw.

Nice ;-)

David
 
Joined
Aug 13, 2008
Messages
361
Points
0
The suspense is killing me. Igor hasn't posted diode hours in 5 days. I know he's busy such so I should be patienent but it's getting harder day after day wondering if the diode died or is well over 100 hours now (the magic number or "goal" was 100).

Question, if the diode makes it to 100 hours can we crank up the ma like mad men bent on destruction? I say feed that diode 400ma and see how long it lives. :D

The experiment was to see if the diode makes 100 hours, that is a hell of a long time for a pointer. Most people won't care if it makes it to 200 hours anyway. Pour on the current please.... :whistle:
 
Joined
Nov 5, 2009
Messages
77
Points
0
I personally don't care if it goes till 200 hr tbh. Well our goal was to reach 100hr to complete the experiment, now we need to interpret Igors findings and see how to progress. Personally, I wouldn't mind the ma cranked up to see how much it can take (keep in mind it has already degraded), If the investors agree to it :)
 

IgorT

0
Joined
Oct 24, 2007
Messages
4,177
Points
0
Sorry couldn't post these sooner guys, it's been a busy week at work.
90h Degradation Plots:


attachment.php


attachment.php


Diode Stats:
- Ith = 37mA
- Po @ 300mA = 325.5mW (91.43% of initial power)
- Slope Efficiency = 1.233mW/mA (Avg.)
- Actual Efficiency = 18.42% Peak / 18.17% Avg.


I've noticed something strange going on, when i was testing the diode at 90h ON-time...

It almost seemed as if the power at lower currents was higher than the last time (60h)! Only at higher currents did it become apparent, that further degradation has taken place.

I re-did this plot like five times, letting the diode warm up, so it's Vf would be closer to the one in the previous test, then powers at lower currents did drop a tiny bit, but still remained higher than earlier, and the powers at higher currents dropped even further.


Degradation seems to be speeding up all of a sudden! And quite a bit.
Only part i don't understand is why the powers seemed higher at low currents... :thinking:

It's easier to make errors with small numbers, since the relative resolution is so much lower, but i repeated it several times and... I don't know, maybe i wasn't this accurate during the previous plot.


Unfortunatelly i didn't get much cycling done in the last few days, cos i needed my big test heatsink to test a huge diode batch, also, if degradation is speeding up, i need to be more careful and start replotting more often again, so i'll check tonight and tomorrow evening to see what's going on and report back.


P.S. CHP, thanks for doing your additional analysis! I'd like to see how the current numbers fit in.
 

Attachments

  • 90h LG 8x #3 P-I Degradation Plot.PNG
    90h LG 8x #3 P-I Degradation Plot.PNG
    82.7 KB · Views: 484
  • 90h LG 8x #3 Efficiency Degradation Plot.PNG
    90h LG 8x #3 Efficiency Degradation Plot.PNG
    76.7 KB · Views: 490

CHP

0
Joined
Sep 30, 2007
Messages
74
Points
8
Latest degradation plot and projected degradation. The projected curve is the same curve since 600 minutes.
 

Attachments

  • las90hr.jpg
    las90hr.jpg
    20.9 KB · Views: 154

IgorT

0
Joined
Oct 24, 2007
Messages
4,177
Points
0
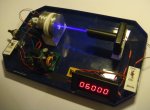
The diode succesfully reached 100 hours ON-Time two days ago. Still alive and kicking! :yh:


This was a very special moment worthy of another photo:

attachment.php


It was only 10h since the previous tests, but since i had a feeling degradation was speeding up i was more careful, and wanted to replot more often.

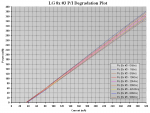
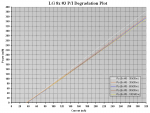
Strangelly, the result was this:

attachment.php


Same power at high currents, but a tiny bit higher power at lower currents! :thinking:
Similar to what i noticed the previous time!


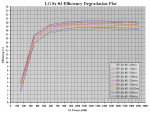
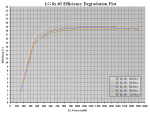
This is even more noticable in the efficiency plot. At the lower powers, the efficiency is higher:

attachment.php


As you can see, the efficiency lines cross, as the later ones exceed the earlier ones at low currents.


And i matched the temperatures as accuratelly as i could, went back and forth a couple of times, checking the meter is zeroed in, the data is accurate....
It's just a little weird that efficiency would climb at lower currents.

Seems a very strange effect for degradation. At higher currents, the power does drop with time, even tho from 90 to 100h this didn't happen.


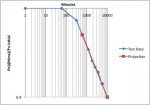
The strange efficiency behavior is why i cleaned up the plots. I left only the ones spaced 30h appart, and the last one of course, to show how it compares to the previous one (starts higher, ends the same).


Now that the unevenly spaced plots were removed, it is suddenly very apparent, how the first 30 hours had a larger impact than the remaining 70 together!


One thing i can't understand is, why degradation is not noticable in 10h, but can be huge in 20 or 30h... It's not the first time this happened.

I guess we'll see at 120h. The show must go on.


Diode Stats:
- Ith = 36mA
- Po @ 300mA = 325.5mW (Same as at 90h)
- Slope Efficiency = 1.233mW / mA Avg. (Same as at 90h)
- Actual Efficiency = 18.53% Peak / 18.26 Avg. (Higher than before?!? :thinking:)


Looking at the old data, both the average and the peak efficiencies are higher than they were before.

This does not make much sense.


I'm starting to think that using the Vf to make sure the temperature is the same is not good enough here. It's quite possible changes happen to the Vf of the diode as it degrades as well. The Vf definitelly changes, when diodes die...

Because of this the second 8x Murder candidate (and the 12x) will have a micro temperature sensor soldered directly onto the bottom of the diode can, and i will use that sensor to make sure the temperatures are the same during all plots (instead of the temperature sensor in the heatsink - too much lag, which is why i used the Vf instead).


Now i have a problem tho. I don't want to stop this experiment because it's the first time i am recording the death of a diode in this much detail. In all previous experiments, all i did was measure the time until death, well power sometimes too, but i didn't make accurate logs of the changes.


The reason i want the bitter end recorded is, that it could tell me what to expect from the second diode, OR the second diode would show that they die much differently from one another, in either case i want to know.

The problem is, while i have the second sensor/counter almost ready, i got them for the 12x experiment.

And now since this diode doesn't want to die, i might have three live diodes at once. And only two counters.


I could probably have had this diode dead by now if i left it running last week, but i was away a lot because of work, and i really didn't want to leave it unattended.


At the same time, i really want to start the second 8x experiment. I should have picked up another counter while i was in Conrad...


I could run one experiment on a time recorder only, but without visual feedback i won't know when to re-plot it. Looks like i need to check local shops for counters, altho i doubt i'll find them. :undecided:


In any case, this diode has surpassed all my expectations by far!
Hopefully it can only get better from this point on, but i guess we'll see (which is why i'm so anxious about the second one!)...
 

Attachments

  • Torture Chamber - 100h ON-Time.JPG
    Torture Chamber - 100h ON-Time.JPG
    96.2 KB · Views: 356
  • 100h 8x #3 P-I Degradation Plot.PNG
    100h 8x #3 P-I Degradation Plot.PNG
    76.3 KB · Views: 367
  • 100h 8x #3 Efficiency Degradation Plot.PNG
    100h 8x #3 Efficiency Degradation Plot.PNG
    71.5 KB · Views: 354
Last edited:

IgorT

0
Joined
Oct 24, 2007
Messages
4,177
Points
0
Latest degradation plot and projected degradation. The projected curve is the same curve since 600 minutes.

Fascinating...

When it deviated from your projection, it later got back in line.. There was a time when degradation seemed to speed up, but now it's as if it's slowing down again...

Except for that one point, it follows the projection almost perfectly! Some deviations from a calculated projection are to be expected of course when compared to real world data..

How many data points did you use to create this projection initially? 0, 1, 5 and 10h?
 
Last edited:

HIMNL9

0
Joined
May 26, 2009
Messages
5,318
Points
0
.....
Looking at the old data, both the average and the peak efficiencies are higher than they were before.

This does not make much sense.
.....

It's easy ..... at the start, the diode was not eating from a long time, so it eated part of the energy that you pushed in it ..... now that are hours that it's eating, it start to feel better, eat less energy, so some more of it come out in form of light .....

J/K, sorry, but can't resist, sometimes :p :D


Seriously:

Now i have a problem tho. I don't want to stop this experiment because it's the first time i am recording the death of a diode in this much detail. In all previous experiments, all i did was measure the time until death, well power sometimes too, but i didn't make accurate logs of the changes.

For that what it can count, i'm with your idea to continue the experiment until the end ..... there's not too much experiments of this type, and is also giving some interesting data, imho, so, why not continue and wait for kill the second one ?

Also cause, after all, for that what i've understood you already have a second setup for the 12X, so this one don't become affected from the "unexpected longevity" of this 8X one, right ? (but hey, don't forget to eat and sleep for this, ok ? ;))
 

jayrob

0
Joined
Sep 21, 2007
Messages
9,862
Points
113
Great work Igor...

I think you forgot to attach the 100th hr. plot pictures. :pop:
 

CHP

0
Joined
Sep 30, 2007
Messages
74
Points
8
Fascinating...

When it deviated from your projection, it later got back in line.. There was a time when degradation seemed to speed up, but now it's as if it's slowing down again...

Except for that one point, it follows the projection almost perfectly! Some deviations from a calculated projection are to be expected of course when compared to real world data..

How many data points did you use to create this projection initially? 0, 1, 5 and 10h?

IgorT,

I used all of the data that you posted here to create the graph.

Here is the latest graph. It may look the same but the last data point marker is a little thicker because both both 90 hr and 100 hr data points are very close on the log-log plot.

The 3600 minute data point that is slightly above the predicted curve is only 0.24% above the straight line prediction. In my opinion, the data shows that your testing is very precise and your test setup demonstrates a high degree of repeatability.
 

Attachments

  • las100hr.jpg
    las100hr.jpg
    21 KB · Views: 122
Last edited:

daguin

0
Joined
Mar 29, 2008
Messages
15,989
Points
113
Is it just me or have the attachments stopped showing up?

Peace,
dave
 

IgorT

0
Joined
Oct 24, 2007
Messages
4,177
Points
0
Great work Igor...

I think you forgot to attach the 100th hr. plot pictures. :pop:

Ok, what the heck?!?

I DID attach them! The texts were referring to the pics embedded into the post...
And i just saw them, then i hit RELOAD, and i see your post, look back up and they dissapeared?!?

How is this possible? :thinking:

I'll fix it immediatelly.


P.S. The diode is pushing on to 120h.. :yh:


EDIT: Fixed the post. It had IMG links in it, but no attachments for the links to refer to, even tho attachments were originally there... And this happened after i reloaded the page, before i saw it as it is now.... I corrected it now, it's the same as before.

Interestingly it seems that CHP also attached a new plot of his own, that dissapeared... Weird. :thinking:
 
Last edited:


Top