Welcome to Laser Pointer Forums - discuss green laser pointers, blue laser pointers, and all types of lasers

Buy Site Supporter Role (remove some ads) | LPF Donations

Links below open in new window

FrozenGate by Avery

8X Diode Murder fund

Igor;

The "average" today on the 12X chart thread is a staggering 606 mw.

That's hard to believe, but I double checked the numbers.

The 1st 8X diode was rated ~200 mw peak pulse power.
It lasted 400 hours @ 150% of peak pulse power: 300 mw.

Both Nichia & Sharp 12X press releases state 320 mw peak power:

150% of rated peak power = 480 mw
160% of rated peak power = 512 mw
170% of rated peak power = 544 mw (~ the power level of 2nd 8X tested)

So somewhere in this range of 150 to 170% would be a good test level.

We need to get an idea of our LPF operating points,
in relation to diode manufacturers peak power rating.


LarryDFW
 
Last edited:


So the old diode reached 450 hours (i missed 440, i was sleeping :whistle:) and it still refuses to die!

I stopped it for a re-plot, and to prepare the Torture Chamber for the 12x.
 
If that 5x ratio I noted earlier between the two graphs stands, you're looking at 195x5=975 hours before death.

By the way, I received the units, and both of them rock. Thanks IgorT!
 
IgorT, not sure if you got my email, but i did receive my laser the other week. Great thanks!

it's a beautiful work of art.
 
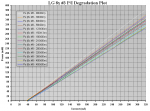
Last re-plot was at 450 hours last week, here's the results:

attachment.php


LG 8x #3 450h Data:
Ith = 40mA
Slope Efficiency = 1.088mW / mA
Absolute Efficiency = 15.91% Avg.
Po @ 300mA = 283mW = 79.49% of initial


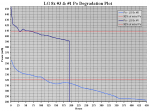
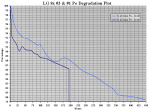
These are the latest Po over Time degradation plots:

attachment.php


attachment.php


Degradation is at it's slowest so far, but the diode dropped under 80% of it's initial power, so it can't last much longer.


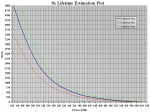
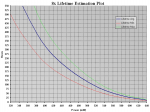
And for the first time, i'm also posting the Lifetime Guesstimation plot...


The first one shows the entire power range from the diode's rated power of 125mW CW up to 640mW CW:

attachment.php


The second one is a "zoom-in" from 320-640mW CW, to show the powers we are more interested in:

attachment.php


The plots show how long an 8x diode would most likelly live, as a function of it's power setting.


As i keep stressing, these Lifetime "Estimation" plots are more of a guess than anything else. They consist of very little actual data.

I took 5000h for 125mW CW, 510h for 356mW CW, 194.85h for 453mW CW and some very low values for 600mW+...

The numbers between the actual known values were simply made up to form as smooth a curve as possible, with the higher up numbers being almost pure speculation, but again an attempt to follow the curve.
In reality the curve may flatline close to zero much sooner...


In fact the plot is not even finished yet, because the old diode is still alive, but for now the plot says it's gonna die at approx 510h. If it should outlast that or die sooner it will change shape a little.


I can't guarantee it's anywhere near accurate, hence the name, but i do find it useful, as it provides me with a rough idea of what to expect at different power settings.


In between the two tested powers, the results should actually be quite close to reality, and up to about 520mW it can't be too far off either, but i'm not too sure about the powers higher up. I almost think the curve should fall faster.

The plot makes it seem as if the life at 640mW would still be 10h, but in reality it could be as little as 1h or even less. There is no way to be sure.


The red and green curves are simply +/-30% of the main curve, to say that even if the main curve was accurate (if we killed 10 diodes to make it), a diode can die anywhere in between, depending on it's individual toughness.


I wasn't sure if i should even post this or not, because like i said, much of it is pure speculation... But perhaps it's better than nothing at all.. :whistle:
 

Attachments

  • LG 8x #3 - 450h PI Degradation Plot.PNG
    LG 8x #3 - 450h PI Degradation Plot.PNG
    93.6 KB · Views: 336
  • Murder Candidates Po vs Time Degradation Plot (in mW).PNG
    Murder Candidates Po vs Time Degradation Plot (in mW).PNG
    75.6 KB · Views: 292
  • Murder Candidates Po vs Time Degradation Plot (in %).PNG
    Murder Candidates Po vs Time Degradation Plot (in %).PNG
    70.8 KB · Views: 293
  • 8x Lifetime Estimation Plot - FULL.PNG
    8x Lifetime Estimation Plot - FULL.PNG
    76.9 KB · Views: 291
  • 8x Lifetime Estimation Plot - Zoom-In.PNG
    8x Lifetime Estimation Plot - Zoom-In.PNG
    75 KB · Views: 289


Back
Top