IgorT
0
- Joined
- Oct 24, 2007
- Messages
- 4,177
- Points
- 0
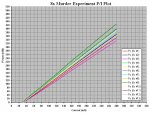
Ok, so with the first two LG 8x diodes i went in 10mA steps up to 360mA..
Later we decided not to be so evil to all of them, so i am testing them with just a few steps measuring Po and Vf for: Ith, 40mA, 80mA, 120mA, 160mA and 200mA..
This is what eventually became my standard testing protocol for 6x's...
It is only a few steps (i'd go crazy if i had to plot EACH of the GGWs in 10mA steps - i know, because i did it at the start) but from experience i know two things:
1. If a diode is good, it will make a "straight" line regardless of the resolution i test it in. In fact, when i plot it in 5 40mA steps, the line will be more accurate, since less heat will be able to develope during the shorter time.
2. If a diode is bad, the 5 step plot will show bends in it, the 40mA steps will bring widelly varying power increases, allowing me to eliminate the weird diode for more detailed testing...
Another thing i know is, that among ALL the GGWs i tested so far (over 70 by now), only one ever displayed "kinks"..
Many others were extremelly low efficiency, so much lower from the rest, that they actually formed their own group, separated from all the normal GGWs, including the low efficiency ones.
As a result there is a gap in the 61 GGW Plot, where there is not one diode that would peak between 160 and 170mW at 200mA - low efficiencies start at over 170mW and the BAD diodes all fall short of 160mW... And the one with kinks was the lowest of them all by far!
Based on that, i believe it is safe to assume, that these diodes came from prototype sleds, and were themselves prototypes, or intentionally purchased reject diodes, used simply for sled optics adjustments and testing...
Diodes from drives never display such bad characteristics, because they go through many tests, before they are released on the market.
So this short five (well, six counting Ith) step test allows me to make accurate 8x plots, where i can extrapolate the higher numbers from, without having to actually push the diodes to 360mA and potentially endanger them, before we even know what a safe power is!
It separates them by efficiency, and allows me to pick out the weakest two.
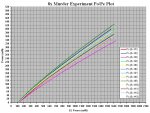
Additionally, as i explained in the Red vs. Blu Comparison thread, i want to compare these 8x's according to their ACTUAL efficiency, meaning i am plotting them against their calculated electrical input power, not just input current. Luckily for me, Excel is multiplying the numbers by itself... :angel:
Also, i have a column automatically calculating their efficiency, and i can already see that it peaks between 160 and 200mA, so in the end, the most accurate way of picking the two weakest ones is just this efficiency column, or rather the separate efficiency plots...
So all i need to do now is type in a lot of numbers and select the two "winners"... :evil:
(After i fetch myself a big mug of coffe...)
P.S. If anyone tries to do a Po/Pe comparison plot of multiple diodes in Excel, you HAVE to use the "X/Y Scatter" type of chart... If you use a regular line-chart, it will NOT draw the plots related to the diode's el. input power, but related to the number of the row/column the data is in!
I realized this during the Red vs. Blu Comparison, where i couldn't convince Excel to make meaningful plots. Rkcstr figured out what i was doing wrong - Thanks Rkcstr!
Luckily the error there was huge and couldn't be overlooked, while it could easily be missed when comparing diodes of the same type, which is why i am mentioning it.
You need to be able to input both X and Y data for each plot separatelly, and this only works with the "Scatter" chart....


