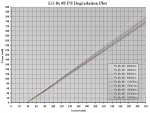
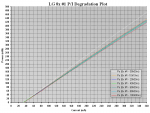
The diodes passed 120 and 260 hours today! :yh:
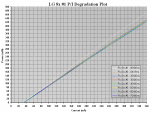
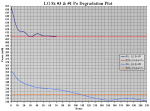
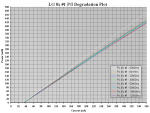
Here is a re-plot of Murder Candidate #2:
Po @348mA = 401.3mW = 88.49% of initial power
Interestingly, this is one of the smallest drops overall. Only 1mW less than 20 hours ago! That's why the latest plot is overlapping the previous one again.
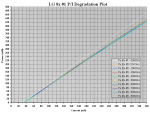
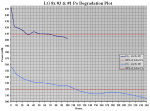
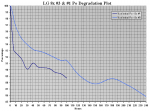
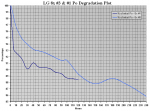
In the more interesting graphs, it looks like this:
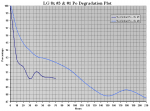
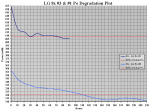
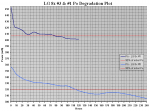
Or in percentage of initial power:
At 70 hours, i said it's possible the second diode's curve will cross the curve of the first diode in this graph. Now it looks even more likelly!
If that happens, or even if it just gets (and remains) very close, i would guess that the second diode is slightly tougher than the first.
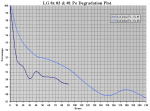
Up until now it degraded faster, set to a higher power that was only to be expected, but it held above 90% for very long, and it's degradation seems to have slowed down more after the initial rapid drop in power.
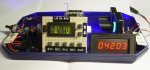
One other possible degradation byproduct i am noticing is an increase in spontaneous emissions. In this case in the form of a "yellow halo".
I noticed this "yellow halo" when plotting PHRs and GGWs in widelly varying intensities. At first i thought it was a sign of damage, but barelly any diode was completelly without it - it was spread completelly at random (i used to write it down next to each test to see if there would be an increase in deaths among those diodes, but there was no correlation).
It could simply be an indication of trace amounts of certain impurities in the die, but without any impact on diode "toughness".
I have no idea if it means anything at all, but in this case it seems to be growing in intensity, because i only started noticing it a few re-plots ago....
I will observe it more carefully in the following tests.
This yellow halo is most visible at low powers, or when looking at the spot through a filter that blocks 405nm partially or completelly, and appears as two different size blobs on either side of the slow axis.
Murder candidate #1 on the other hand (or rather 8x's set to 360mW) can pretty much be declared "immortal" at this point. Even if the diode dies soon, 260 hours is gonna be hard for anyone to reach in a handheld pointer!
But while that test is running at 300mA, this might not mean that all diodes will survive this current aproximatelly as long. A very high efficiency diode that produces 450mW at 300mA could degrade as fast as the second murder candidate does at 348mA.
That's the feeling i'm getting observing these diodes - as if the power they produce matters more than current for their lifetime....


")
")