IgorT
0
- Joined
- Oct 24, 2007
- Messages
- 4,177
- Points
- 0
Thanks for doing this, i'll have the results in a moment.
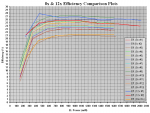
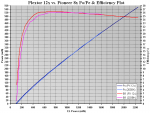
Well, the different spread and of the data points does explain the crossing of the lines at the beginning of the efficiency plots.
But after that the behavior of your tested 8x is identical to all the others - it follows the same pattern....
It does not explain why your 12x's drop in efficiency so suddenly at the higher currents..
The weird peak with the first one probably was an error (altho it would be VERY useful to re-check that part, at least the start), but since the random 8x follows the same patterns as all the other tested 8x's afterwards, while the 12x's don't...
Something is definitelly different about them! :thinking:
Uploading pics....
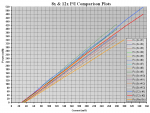
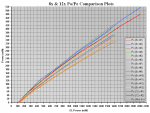
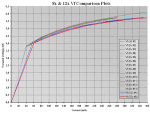
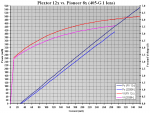
Ok, so the bad news... The comparison 8x (called "Rnd 8x" for "Random 8x" in the plots) is the lowest in slope efficiency i have seen - lower than the 8x being tortured at this moment. But it has a much lower Vf than most other 8x's. Once this is taken into account, it becomes better than the first murder candidate..
The good news.. While the weird efficiency "peak" at the very start was mostly just a result of differently spread data points in the plots, as shown by the new 8x (it crosses the efficiency line of the lowest 8x in the plots at the start, like the 12x's did), the 8x later behaves normally and follows the exact same pattern as all the other 8x's. It's efficiency flattens out!
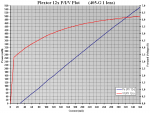
With the 12x's efficiency drops at the higher currents, and that's what doesn't make sense. I thought it was because of heat developed during plotting, but then it would show with this 8x, since it's a low efficiency one and creates much more heat than most other diodes at the same currents.
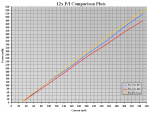
What makes 12x's different from the 8x's is not the peak, but the "hump" they display in the efficiency plot, and the fact that their slopes are not straight (if they were, there would be no "hump")...
They definitelly don't follow the same pattern as all the 8x's!
It suddenly seems quite possible that they are new diodes.
In fact, unless there were some horrible errors made during their plotting (which is very unlikelly, if not completelly impossible at this point), they most definitelly are not the same as 8x's!
The only thing that i don't like is that they don't make straight lines... I need to plot one in high resolution to see what's going on.
But heck, as long as they are rated for a higher power, who cares, right?
I just hope the bends are not the results of kinks. :undecided:
EDIT: Kinks are unlikelly, they would show up much more severelly... But it seems like with 12x's plotting will once again require a high resolution...
In any case, i am suddenly becoming interested in these diodes! I got Dave's 12x sled a few days ago and the little diode heatsink just arrived, so i can also do the sled efficiency comparison over the weekend... :yh:
Attachments
Last edited:


