Welcome to Laser Pointer Forums - discuss green laser pointers, blue laser pointers, and all types of lasers

LPF Donation via Stripe | LPF Donation - Other Methods

Links below open in new window

ArcticMyst Security by Avery

Spectral Emission line DB

Joined
Feb 2, 2012
Messages
577
Points
43
I have put together some information from the NIST database on Spectral Lines emmitted from 20 different Elements. I also added Graphs to make it easy to see were the strong lines are.

It's surprising how many lines some elements emit in the visable spectrum. Eg, Mercury emits 40 seperate lines. Out of that only 6 are strong lines.

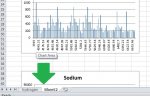
The first sheet in the Excel File shows the Element and the emited spectral lines. The Wavelength is in Angstroms. Divide by 10 to get Nm. The intesnisty of the line I am not sure what units it is.

I was surprised to learn that Argon has some very strong lines in the Orange to Red spectrum. The normal 488nm etc lines from an Argon laser are quite low output. I guess that's why an Argon laser is so inefficient.

Excel Spreadsheet of Spectral Lines

Hopefuly some members will find it usefull. I wanted it to help decide which Spectral Discharge Tubes would be better for calibrating a Spectrometer.
 
Last edited:


kecked

0
Joined
Jun 18, 2012
Messages
947
Points
63
I was looking on eBay and find they combine argon and mercury for calibration sources. Add in neon for some reds. Wonder if you can put all three in a single source. Prob better having separate tubes.

I was looking at the replacement sensors on eBay that cut second order interference and add uv sensitivity. Wonder if they are worth the effort. Not sure why these seem to not let you get to the higher pixel numbers like 2000-2400. It would seem if the grating was set as such you’d see more lower pixels in the 400-450 range but you don’t.

I would think with 2400 pixels 400-800nm would be possible. Maybe the sensor is deaf above 450nm. This replacement might be a way to correct that but then your in the cost range to just buy one already doing that.

I think 1nm accurate is fine for Raman matching and fish tank testing.
 
Joined
Feb 2, 2012
Messages
577
Points
43
I think you will find the CCD in these is only 2048 Pixels. The grating gives about 10 pixels per nm. Resulting in about a 200nm bandwidth. Approx 450-650nm.

I have looked at Neon and decided there are just to many lines near each other at similar intensities. It would be difficult to find the correct lines for calibration.
 
Last edited:
Joined
Sep 26, 2016
Messages
52
Points
8
I was looking on eBay and find they combine argon and mercury for calibration sources. Add in neon for some reds. Wonder if you can put all three in a single source. Prob better having separate tubes.

I was looking at the replacement sensors on eBay that cut second order interference and add uv sensitivity. Wonder if they are worth the effort. Not sure why these seem to not let you get to the higher pixel numbers like 2000-2400. It would seem if the grating was set as such you’d see more lower pixels in the 400-450 range but you don’t.

I would think with 2400 pixels 400-800nm would be possible. Maybe the sensor is deaf above 450nm. This replacement might be a way to correct that but then your in the cost range to just buy one already doing that.

I think 1nm accurate is fine for Raman matching and fish tank testing.

You could change the grating and get a wider bandwidth at the cost of resolution.

I think you will find the CCD in these is only 2048 Pixels. The grating gives about 10 pixels per nm. Resulting in about a 200nm bandwidth. Approx 450-650nm.

I have looked at Neon and decided there are just to many lines near each other at similar intensities. It would be difficult to find the correct lines for calibration.

I took a sample of a neon light I have and compared it to some charts I found online. At first I thought the same as you, way too many lines but after looking closer at it I noticed it had the same pattern as the charts I found online. It was good enough to let me know my calibration is off a little at the ends lol.
 

kecked

0
Joined
Jun 18, 2012
Messages
947
Points
63
I used neon and it was a pain but worked. So maybe I go usb2000 surplus or such. It’s just such fun with these because they are so inexpensive. I want to build a course around them. Change gratings align calibrate. Not many places do that kind of thing because the cost would be through the roof.

A friend of mine brought this to me and gave me cal for hene green, hene red, and a few others so all told I have about 20 lines to calibrate with. Most of my interest is down in the 700range at the moment.
 
Joined
Feb 2, 2012
Messages
577
Points
43
I used neon and it was a pain but worked. So maybe I go usb2000 surplus or such. It’s just such fun with these because they are so inexpensive. I want to build a course around them. Change gratings align calibrate. Not many places do that kind of thing because the cost would be through the roof.

A friend of mine brought this to me and gave me cal for hene green, hene red, and a few others so all told I have about 20 lines to calibrate with. Most of my interest is down in the 700range at the moment.

You can get these from the Science Surplus store with different gratings. But as said wider bandwidth means lower resolution.

I would like a USB4000 but a bit expensive even used.
 
Joined
Jan 21, 2018
Messages
324
Points
43
I used neon and it was a pain but worked. So maybe I go usb2000 surplus or such. It’s just such fun with these because they are so inexpensive. I want to build a course around them. Change gratings align calibrate. Not many places do that kind of thing because the cost would be through the roof.

A friend of mine brought this to me and gave me cal for hene green, hene red, and a few others so all told I have about 20 lines to calibrate with. Most of my interest is down in the 700range at the moment.

The usb2000 is a very good device , but .... it is the same sensor in it like in the B&W-TEK .... 2048 pcx.
 
Last edited:
Joined
Sep 20, 2013
Messages
17,386
Points
113
I'm assuming your lines are in Angstroms since you neglected to use any units. You said you also put each element in a spectrum. I couldn't find that. It is good information, though.
 

kecked

0
Joined
Jun 18, 2012
Messages
947
Points
63
Was looking at the spreadsheet. Thank you for your efforts. It will be very useful.
 
Joined
Feb 2, 2012
Messages
577
Points
43
I'm assuming your lines are in Angstroms since you neglected to use any units. You said you also put each element in a spectrum. I couldn't find that. It is good information, though.

Yes, They are in Angstroms. I did mention that in the first post.

You should see 2 Sheets in the Excel file. One has the Data and the other has the graphs.
 
Joined
Sep 20, 2013
Messages
17,386
Points
113
I just checked again and all I get are the lists. I see the Angstrom remark in the post now. I read it twice looking for units. Don't know how I missed it.
 
Joined
Feb 2, 2012
Messages
577
Points
43
I just checked again and all I get are the lists. I see the Angstrom remark in the post now. I read it twice looking for units. Don't know how I missed it.

What version of Excel are you using ?

There should be a Tab down the bottom to select which sheet to view.
 

Attachments

  • Sheet.jpg
    Sheet.jpg
    53.8 KB · Views: 26
Last edited:
Joined
Sep 20, 2013
Messages
17,386
Points
113
Thanks for the picture. Found them. Can't tell which lines correspond to the wavelength under the graph. I suppose I could figure it out by the relative intensity of the lines in the spread sheet.
 
Joined
Feb 2, 2012
Messages
577
Points
43
Thanks for the picture. Found them. Can't tell which lines correspond to the wavelength under the graph. I suppose I could figure it out by the relative intensity of the lines in the spread sheet.

Yep, The Graph is just a guide to help find the Strong Lines. Once you know approx were they are you can look in the Data Tables for the precise wavelength.
 
Joined
Sep 20, 2013
Messages
17,386
Points
113
Nice. Thanks for posting them. Should come in handy for people trying to calibrated their spectrometers. I just got my 575nm laser in and it has a gorgeous yellow dot with speckle all around it at 15 feet. Can't wait to get back into it. :thanks:

I'm out of rep at the moment, but will get you later today. Unless I got you just recently.
 
Joined
Feb 2, 2012
Messages
577
Points
43
Nice. Thanks for posting them. Should come in handy for people trying to calibrated their spectrometers. I just got my 575nm laser in and it has a gorgeous yellow dot with speckle all around it at 15 feet. Can't wait to get back into it. :thanks:

I'm out of rep at the moment, but will get you later today. Unless I got you just recently.

Sounds great. Australia Post seems to be slow with mine. Expected today but not delivered. Hopefully tomorrow.


Top