- Joined
- Jan 7, 2007
- Messages
- 6,334
- Points
- 83
I've posted several times about graphing your diode I(current) vs P output to find the knee of the curve. This is one way to find where your LD is crapping out and will give you no more. Beating the LD with current until output improves doesn't hold here.
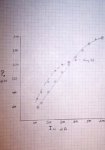
I graphed two diodes today with my TEC cooled module. I did this by hand using my LPM-1 power meter in 50 mA steps.
The lower curve is a SenKat GB diode and the higher one is an open can harvested from a 20x DVD. Note the differences !! The GB is more efficient up to about 200 mW but the open can has a poorer efficiency slope up to 300 mW.
I hope this graph comes through OK. It shows where to back off !!! Every LD is a little different and will have a different curve by a little bit.
Mike


