Calculating the numbers to Calibrate a Spectrometer requires the calculation of the 3rd order Polynomial values.
The easiest way I have found is to use an Excel Spreadsheet. I will go thru the steps involved. After you have done it once it's pretty straight forward to do.
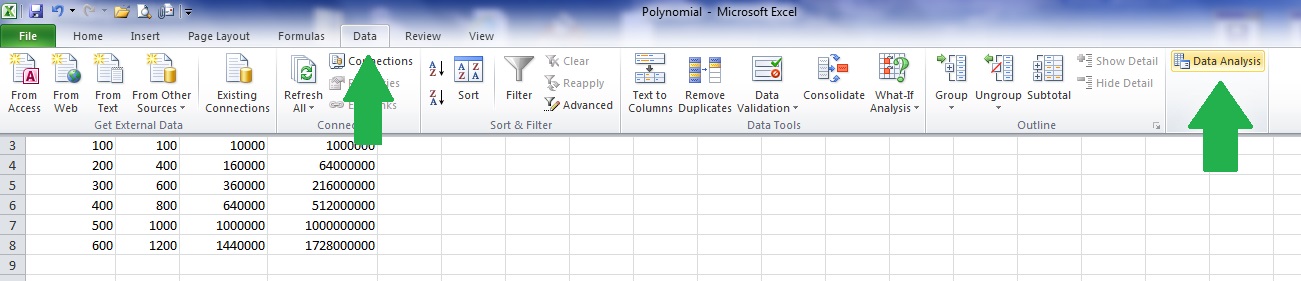
Excel has a Plugin called "Data Analysis Tools". It's not included with the standard install of Excel so you will need to find the Plugins / Addons tab and select Data Analysis Tools and Excel will download and install it for you.
I have included an Excel Spreadsheet to get you started. Download Excel Polynomial Sheet
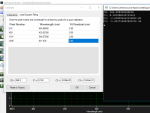
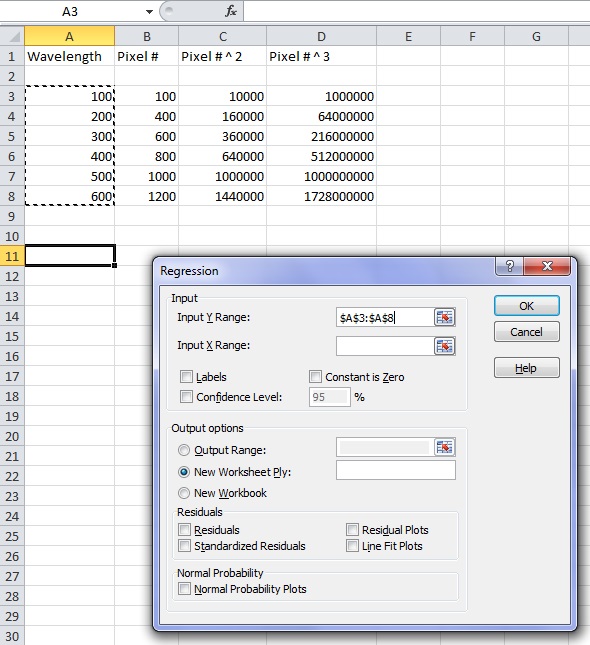
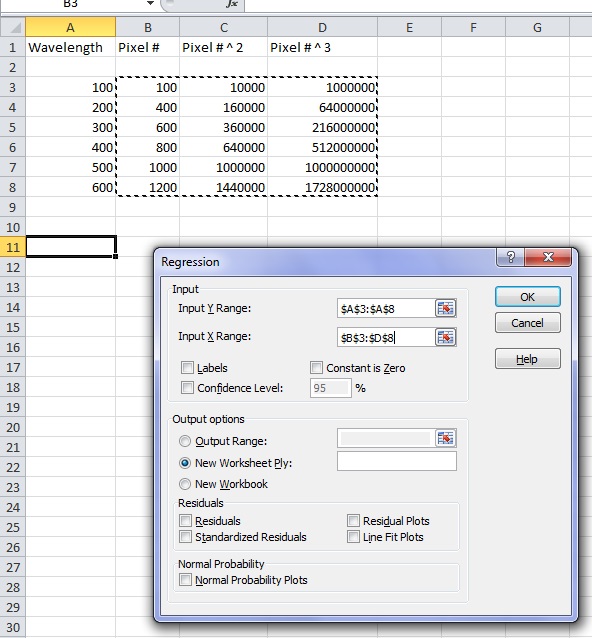
Once you load the Sheet into Excel you can enter your data. You will need a min of 3 sets of calibration points. The sample sheet shows 6 points. Each point consists of the Actual Wavelength and the Pixel number. The Pixel ^ 2 and Pixel ^ 3 are automaticaly calculated.
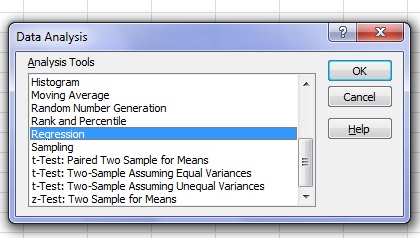
Once you enter your data you need to Click on the "Data" Tab then the "Data Analysis" Tab.
After doing that you need to select "Regression" from the box that appears. Then click ok.
The next step is to select the data input ranges. Click on the "Input Y Range" tab and highlight the values for wavelength as shown in the Pic then hit enter.
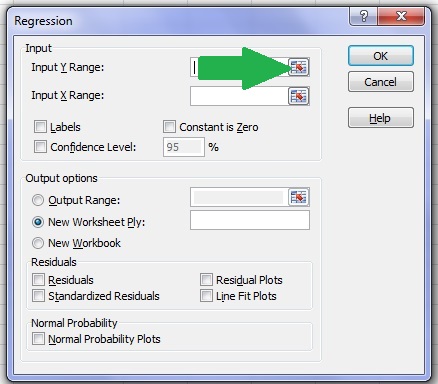
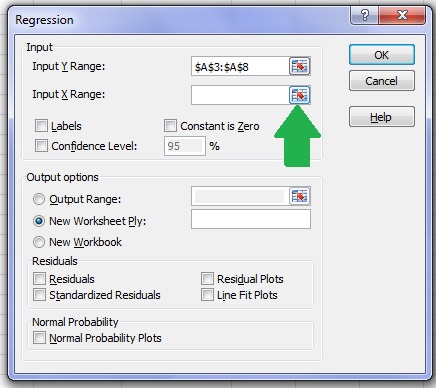
Next we need the "Input X Range". Now select all the Pixel Data. All 3 colums then hit enter.
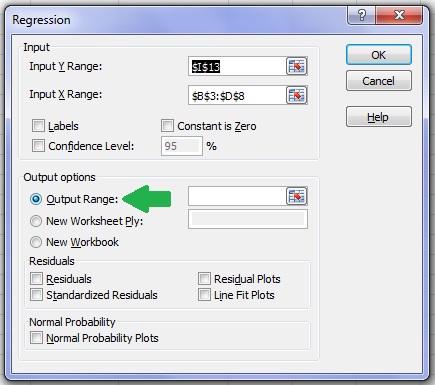
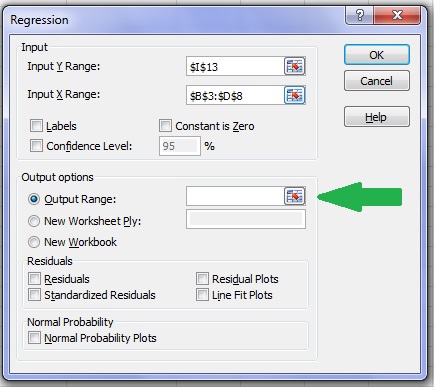
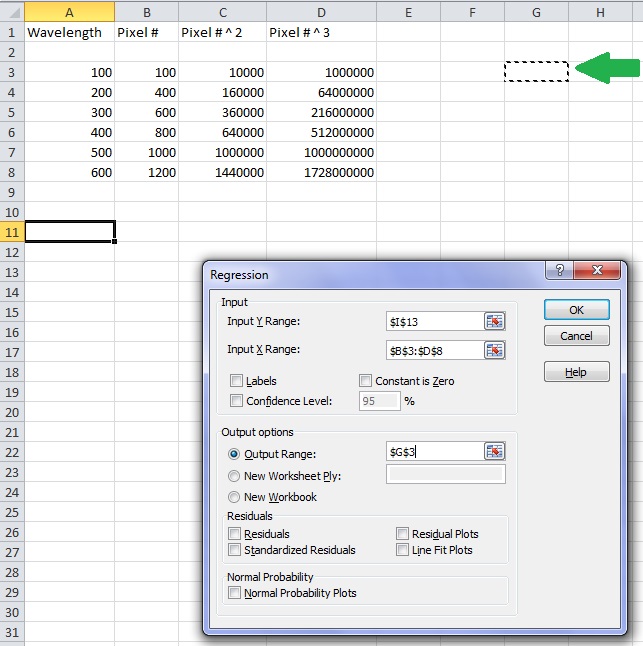
Finnaly we need to tell Excel were to place the output results.
Click the "Output Range" button. Then Output range selection box. Now select an area on the sheet were to place the data. Were you place it is not important. Then hit enter.
Now for the magic. Click on the OK button and after a short time the output results will be displayed.
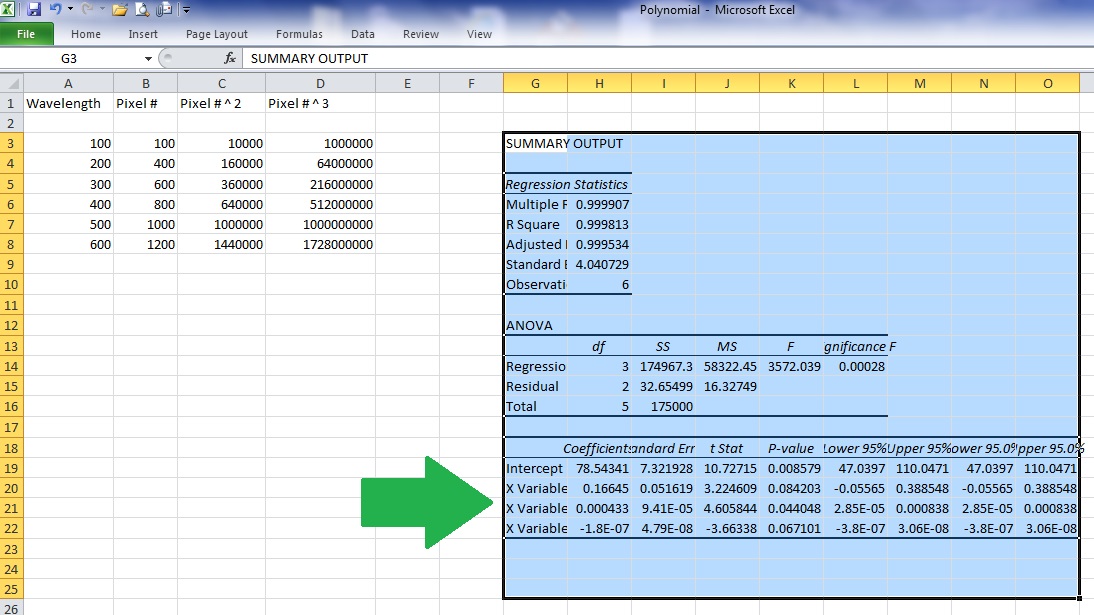
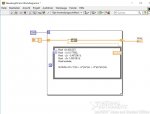
The 4 Pieces of Date we require for calibration is the 4 next to the arrow. From top to bottom.
Intercept
X Variable 1
X Variable 2
X Variable 3
That is the data to enter into the calibration box in the Spectro software.
One thing you need to be aware of is the limits of the calibration data. It is only accurate between the Max and Min calibration points. If you try to measure a laser above the Max calibration point or below the Min calibration point there will be huge errors. The Calibration curve can even wrap around at either end.
IE, If you have a Min calibration point at 490nm and try to meassure a laser at 450nm the reading will be very innacurate. The same thing will happen at the upper limit.
I have done this quickly at work. If there are errors or any questions please ask.
The easiest way I have found is to use an Excel Spreadsheet. I will go thru the steps involved. After you have done it once it's pretty straight forward to do.
Excel has a Plugin called "Data Analysis Tools". It's not included with the standard install of Excel so you will need to find the Plugins / Addons tab and select Data Analysis Tools and Excel will download and install it for you.
I have included an Excel Spreadsheet to get you started. Download Excel Polynomial Sheet
Once you load the Sheet into Excel you can enter your data. You will need a min of 3 sets of calibration points. The sample sheet shows 6 points. Each point consists of the Actual Wavelength and the Pixel number. The Pixel ^ 2 and Pixel ^ 3 are automaticaly calculated.
Once you enter your data you need to Click on the "Data" Tab then the "Data Analysis" Tab.
After doing that you need to select "Regression" from the box that appears. Then click ok.
The next step is to select the data input ranges. Click on the "Input Y Range" tab and highlight the values for wavelength as shown in the Pic then hit enter.
Next we need the "Input X Range". Now select all the Pixel Data. All 3 colums then hit enter.
Finnaly we need to tell Excel were to place the output results.
Click the "Output Range" button. Then Output range selection box. Now select an area on the sheet were to place the data. Were you place it is not important. Then hit enter.
Now for the magic. Click on the OK button and after a short time the output results will be displayed.
The 4 Pieces of Date we require for calibration is the 4 next to the arrow. From top to bottom.
Intercept
X Variable 1
X Variable 2
X Variable 3
That is the data to enter into the calibration box in the Spectro software.
One thing you need to be aware of is the limits of the calibration data. It is only accurate between the Max and Min calibration points. If you try to measure a laser above the Max calibration point or below the Min calibration point there will be huge errors. The Calibration curve can even wrap around at either end.
IE, If you have a Min calibration point at 490nm and try to meassure a laser at 450nm the reading will be very innacurate. The same thing will happen at the upper limit.
I have done this quickly at work. If there are errors or any questions please ask.
Last edited: