Welcome to Laser Pointer Forums - discuss green laser pointers, blue laser pointers, and all types of lasers

LPF Donation via Stripe | LPF Donation - Other Methods

Links below open in new window

ArcticMyst Security by Avery

iPhone Spectroscope (CCD-CD spectroscopy)

Joined
Jul 4, 2008
Messages
2,499
Points
113
Hey there, I have just been playing with my homemade CD spectroscope after getting a little inspiration from an article about a mini-glass ball spectroscope that a team of researchers developed for the iPhone and other CCD based phones.

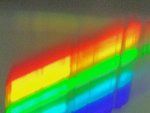
Anyways... I made this quick and dirty CD spectroscope and used my iPhone 4S camera as my sensor.

I started first with a Hg CFL bulb. I noticed right away... the Hg spectra lines.

I wonder how this will work for coherent sources. I'd need a complete spectral line to compare.... got me thinking.

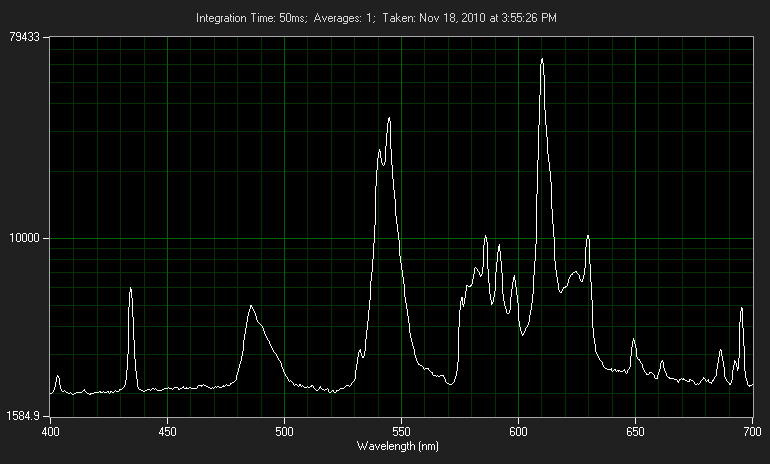
Last picture I was too close to my source and got contaminated spectrum.
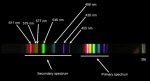
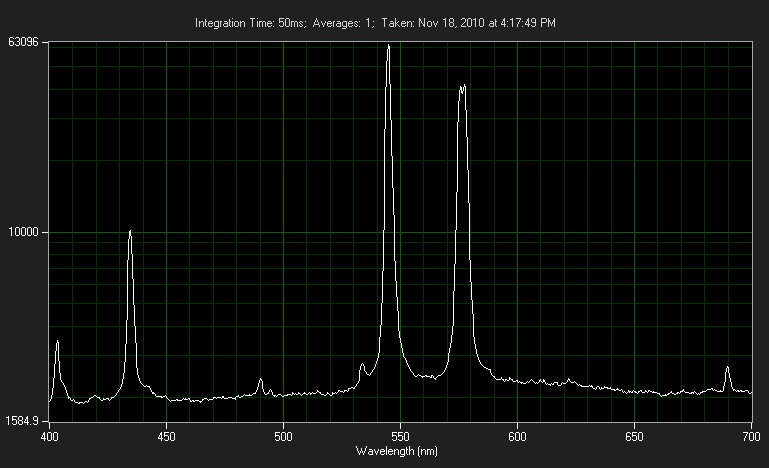
2nd picture also shows a bit of contamination but is cleaned up.. 1st picture shows a near perfect Hg line.
The bright spots are specific to only Hg discharge tubes.

Using iPhoto I straightened out my spectra lines and cropped horizontally across the picture.
 

Attachments

  • IMG_0464.jpg
    IMG_0464.jpg
    28.3 KB · Views: 358
  • IMG_0459.JPG
    IMG_0459.JPG
    23.9 KB · Views: 295
  • IMG_0461.JPG
    IMG_0461.JPG
    100.1 KB · Views: 806


Joined
Jul 4, 2008
Messages
2,499
Points
113
Here is a properly made spectra line of Hg, ... now you can see where the line from my CD-spectrograph fit using this picture as a base.

Using a coherent source you'd probably be able to identify approximately what nanometer your laser is outputting. In the case of Argon-ion gas lasers you've quite a few lines in the green and blue... this would be interesting as an experiment.

In the second spectra line I added my bluray. I used a white wall to scatter the light overtop of my Hg light source. If you notice on the diagram there is a line for 405nm in Hg. It is however quite weak.

Take a look at the spectra lines now on far the right.

405nm is much stronger indicating the laser source is after the black gap on the end near to the aperture line.

Now, I'm thinking about what it would take to produce a hobby CCD/CMOS based spectroscope...
I'm thinking that a scanner sensor being a horizontal sensor would do the job nicely. After setting this up, on an Arduino one could write a histogram
with a corresponding value in nm. Worth a shot? Could it be done?
 

Attachments

  • annotated_cereal_box_mercury.jpeg
    annotated_cereal_box_mercury.jpeg
    40.8 KB · Views: 4,138
  • IMG_0470.JPG
    IMG_0470.JPG
    42.7 KB · Views: 255
Last edited:
Joined
Sep 12, 2007
Messages
9,399
Points
113
I see no mercury lines in your picture. The only two that are easy to pick out even in a spectrograph are 436 and 405, and I don't see those. The rest are not lines, they are broad phosphor emissions. Here's your typical tri-phosphor CFL:

CFL-3000K-Sylvania-23W.png


Compare that with an actual high-pressure mercury lamp:

MetalHalide-Quartz-10000K-Artemis-175W.png
 
Joined
Jul 4, 2008
Messages
2,499
Points
113
Yes I can see there are phosphor lines
As well being represented. Last pic shows the Hg lines.
Keep looking at my last pic and you'll see the
Characteristic 611nm line the green and 405nm line are all there.

Im providing a concept only here, nothing more
 
Last edited:


Top