Welcome to Laser Pointer Forums - discuss green laser pointers, blue laser pointers, and all types of lasers

LPF Donation via Stripe | LPF Donation - Other Methods

Links below open in new window

ArcticMyst Security by Avery

Pioneer 12X Blu-Ray-- BDR-205

daguin

0
Joined
Mar 29, 2008
Messages
15,989
Points
113
Could you give me some advice on where to start looking/reading to learn more about what you teach? I don't have subjects like that on engineering.

You will have to be a little more specific. I teach enough different courses to keep you busy for a year or two ;) Choose from the list above (or ask whatever else you want)

Peace,
dave


Joined
Feb 1, 2008
Messages
2,894
Points
0
It appears that Dave's first 12X diode follows a linear equation that looks something like

y = 1.600x - 40.19

and his second diode follows something like

y = 1.486x - 35.85


If those diodes never changed their efficiency, it can now be inferred that the threshold currents are 40.19mA, and 35.85 mA.

Those two thresholds are significantly different....
 

IgorT

0
Joined
Oct 24, 2007
Messages
4,177
Points
0
I'm sure IgorT will eventually chime in here, but to me it looks like the two 12X's are just one "good" 8X and one "normal" 8X

If that ends up being the case, I've got PLENTY of 8X's now ;)

Thank you so much for doing this, FrancoRob

I was so busy preparing the 8x Murder Experiment i completelly missed this here...
But i got the 12x sled for optics efficiency comparison, and came to check...


This strange efficiency curve in Franco's plots (attached) confuses me.
But i have a suspicion. Altho i'd prefer it would be wrong, cos it would mean it's a new diode...


Since your data is not made in even steps and starts at 60mA, if Franco used a normal line plot, Excel would deform the graphs (what type of plot was used?)....

This is why i extrapolated 50mA last time, to get evenly spread out steps.
A better way is to use an "XY Scatter" plot in Excel. In that case the step size being different does not matter, since it accepts numbers for the X axis, instead of just using the row the number is in.


My 8x plots are all XY Scatter plots (it's the only way to make a correct Po/Pe plot). I can easily add your original numbers and plot them against 8x's correctly, to see if this was the problem, or if they actually have a weird efficiency curve.


Cos i've never seen an efficiency curve like this, and the P/I and Po/Pe plots are also bent in a way that suggests Excell didn't plot them correctly.


If i only saw one such strange efficiency plot, i'd think it's from measurement errors, but both 12x diodes follow the same pattern, so it's not a coincidence. But the other thing that follows the same pattern is how they were plotted. The first step was 57mA with the first and 60mA with the second 12x, the second step was 100mA and every other step 50mA higher....

If the efficiency were to keep this form in an XY scatter plot, i'd say they are different diodes, but i fear that once the varying step size is taken into account they will form the same curves as 8x's.


EDIT: Ah, i see you're already discussing the issue... It's due to Excel assuming that the data is evenly spread out, and simply distributing the X axis by the row (or column) the data is in, instead of by actually taking values in that cell into account for the X axis.

I noticed this when trying to compare Red and Blu diodes by their Po/Pe plots - there the X axis (electrical power) has to be based on calculated data, and since it's a factor of current and voltage, it's not evenly spread out in each next row - the step size varies.

That's why you have to select a different TYPE of plot in Excel. It's called XY Scatter plot. There, it allows you to separatelly input both X and Y data. Normal plots ONLY allow you to imput the Y data, while X is distributed by the number of the row the data is in, instead of the actual value in the cell.


Since Dave started at 60mA, he should have continued in 60mA steps, then the problem would not present itself, except in the plots where electrical power is used for the X axis.. Luckily the correct plot type will solve this issue.
 

Attachments

  • 12x Diode Efficiency.png
    12x Diode Efficiency.png
    333.4 KB · Views: 148
Last edited:

IgorT

0
Joined
Oct 24, 2007
Messages
4,177
Points
0
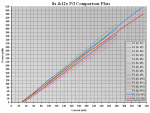
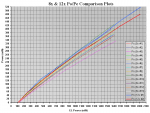
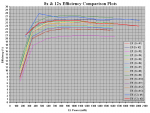
Ok, i added the 12x's into my 8x plots, i used fat lines to make them stand out.

It didn't come out as i expected, both 12x plots are bent in weird ways, even tho i used the "XY Scatter" Plots..
But the second 12x data seems less deformed, and the pattern is slightly different, so there are probably some measurement errors involved (Dave mentioned the current data not being accurate with the first diode)...


This is what i get when i add them into 8x plots, with the data points properly spread out. Looks like i was wrong about the reason for the weird pattern....

I don't understand why slope efficiency is changing so drastically with each step, while the 8x's make straight lines...


Dave: Do you have any 8x PIV data recorded in the same way (same kind of steps)?

If they are the same diodes, they should be forming the same kind of plots, and besides, 6x's and 8x's made straight plots, while both 12x's follow a strange distinct pattern.

The issue is most noticable in the efficiency plots...


What are the chances of making big enough errors when writing down the numbers, and then REPEATING the same mistakes in the same exact way, when testing the second diode? :thinking:

I mean, it's impossible to make 100% accurate readings at every step of every diode test, but usually the errors are small, and they don't create a distinct pattern, that repeats itself...

Are any of your 8x plots bent like this?


P.S. Otherwise, i wouldn't say that one is high and the other average efficiency, compared to 8x's...
If they are 8x's, they are both high efficiency ones! The first one even a freak!

If the strange bends are nothing else but measurement errors, these are very likelly same as 8x diodes, yes, but so far they seem like "cherry picked" 8x diodes.....
 

Attachments

  • 8x & 12x P-I Comparison.PNG
    8x & 12x P-I Comparison.PNG
    103.1 KB · Views: 276
  • 8x & 12x Po-Pe Comparison.PNG
    8x & 12x Po-Pe Comparison.PNG
    97.2 KB · Views: 216
  • 8x & 12x Efficiency Comparison.PNG
    8x & 12x Efficiency Comparison.PNG
    62 KB · Views: 241
Last edited:

IgorT

0
Joined
Oct 24, 2007
Messages
4,177
Points
0
That's an artifact from Excel trying to guess at what is happening between the known points. Look at the raw data, Dave measured every 50mA. Excel looked at the points every 50mA, and tried to draw a polynomial between those points, and to be quite honest, didn't do a very good job in that case. Replotting it with a different chart type gives a different shape.

It's not (just) Excel...

My 8x data is in 40mA resolution, because i don't want to waste time plotting in more detail to get straight lines.
And my 8x Efficiency Plots look nothing like Dave's 12x's if i add them.


At first i thought the strange deformity at the start of the Efficiency plot is because Franco used the usual line chart type, but i was wrong..

I used the XY Scatter type, i don't smooth the lines if it can be avoided (cos it moves the measured data points sometimes), and yet somehow 8x's and 12x's are forming different patterns.

The 8x patterns are all the same, simply varying by efficiency, and the 12x patterns are the same - well, at least very similar - but between the 8x's and 12x's there are considerable differences.


Unless Dave is doing something wrong when recording these numbers, and somehow magically repeating his errors the exact same way twice, something strange is going on here... :thinking:


It would be easy to dismiss the differences saying they are errors, but measurement errors go both ways (+/-), and usually don't form a distinct pattern that repeats itself.
And if one of Dave's DMMs was defective in a non-linear way, it would show in his 8x plots.. I don't recall seeing his 8x plots "bent" in this strange way...


I have no idea what this is, i just wish i could test one myself...


EDIT: Hmm, i had some more time to think about it. The only diode to really stand out is 12x #1.. All 8x's i tested peaked in efficiency between 160 and 200mA, while 12x #1 peaks in efficiency at 100mA and then rapidly drops. But Dave said he wasn't very accurate with the first one, so that's probably the reason...

There are some differences later, but they are not so extreme, there is a significant drop in efficiency above a certain power, but Dave mentioned he is without his big test-heatsink..

I believe the differences to come from a different test setup. While in most cases high resolution plots are not required due to the linear behavior of these diodes, the efficiency plots would benefit from a higher resolution at least between Ith and 120mA, where the largest changes take place. If i were to record the 100mA point in my 8x plots, the efficiency curves would probably be more similar to 12x #2 - at the start i mean....


I think the errors resulting in the plot differences come not from the measuring devices, but from the time it takes to make the plots using a regular driver, and the heat that developes during that time...

If the 12x's were tested on the same equipment and in the same way as the 8x's (or vice versa), they would very likelly form much more similar plots.


So... They are very similar to high efficiency 8x's. Ith is not higher, it actually seems lower (need to check), so they COULD be the same diodes or at least efficiency-selected diodes of the same type, but on the other hand, as you mentioned, it's possible that they were made tougher, without this resulting in easily measurable changes....
 
Last edited:
Joined
Dec 26, 2007
Messages
6,129
Points
0
You will have to be a little more specific. I teach enough different courses to keep you busy for a year or two ;) Choose from the list above (or ask whatever else you want)

Peace,
dave

Argumentation, debate, rhetoric & oral interp. :)
 

daguin

0
Joined
Mar 29, 2008
Messages
15,989
Points
113
I think the errors resulting in the plot differences come not from the measuring devices, but from the time it takes to make the plots using a regular driver, and the heat that developes during that time...
If the 12x's were tested on the same equipment and in the same way as the 8x's (or vice versa), they would very likelly form much more similar plots.
So... They are very similar to high efficiency 8x's. Ith is not higher, it actually seems lower (need to check), so they COULD be the same diodes or at least efficiency-selected diodes of the same type, but on the other hand, as you mentioned, it's possible that they were made tougher, without this resulting in easily measurable changes....

I do have one more 8X I could press and test, replicating the conditions of 12X #2. Then FrancoRob could plot it using the same program and formula to see if it gives us the same shape.


Argumentation, debate, rhetoric & oral interp.

LOL! I was kind of hoping you could focus on one and we could move from there. Rhetoric is the overall "label" for persuasive speaking. It is more theory based and based in the antiquities. Argumentation is the application of rhetoric. Debate is the formalization of argumentation (usually in a competitive context). Oral Interpretation of Literature focuses more on how to bring a narrative "to life."

Peace,
dave
 
Last edited:
Joined
May 14, 2008
Messages
468
Points
0
I do have one more 8X I could press and test, replicating the conditions of 12X #2. Then FrancoRob could plot it using the same program and formula to see if it gives us the same shape......

Peace,
dave

I have saved all the comparison data. Give me the new ones, Dave, and I'll implement the plots! :yh:
 
Joined
Dec 26, 2007
Messages
6,129
Points
0
I do have one more 8X I could press and test, replicating the conditions of 12X #2. Then FrancoRob could plot it using the same program and formula to see if it gives us the same shape.


LOL! I was kind of hoping you could focus on one and we could move from there. Rhetoric is the overall "label" for persuasive speaking. It is more theory based and based in the antiquities. Argumentation is the application of rhetoric. Debate is the formalization of argumentation (usually in a competitive context). Oral Interpretation of Literature focuses more on how to bring a narrative "to life."

Peace,
dave


Then I'd like to start with rhetoric, please :)
 
Joined
Dec 6, 2008
Messages
1,581
Points
63
I think the efficiency level between 100 and 150ma denotes some significant diode improvements.

None of the 8X diodes approach that efficiency level.

I do still think the 12X will last a lot longer @ 400mw or higher.
it's possible that they were made tougher, without this resulting in easily measurable changes.... Igor

Sharp and Sony both have 320mw laser diodes in production for 12X ...

I think they are 320mw diodes ...
vs. 250mw for the 8X.

LarryDFW
 
Last edited:
Joined
Aug 31, 2009
Messages
2,157
Points
0
I think the efficiency level between 100 and 150ma denotes some significant diode improvements.

None of the 8X diodes approach that efficiency level.

I do still think the 12X will last a lot longer @ 400mw or higher.

I think they are 320mw diodes ...
vs. 250mw for the 8X.

LarryDFW

That would make them worth it then thats for sure. I would love to buy one if its even just a hair better than the 8x
 
Joined
Dec 26, 2007
Messages
6,129
Points
0
That would make them worth it then thats for sure. I would love to buy one if its even just a hair better than the 8x

You're saying that just for getting the one that's better. Just wait 'till the 8x drives come down in price because of the release of 12x's and you'll see that if (and only if) the 12x is the same or almost exactly the same, members will start buying 8x's instead of 12x's.
 

IgorT

0
Joined
Oct 24, 2007
Messages
4,177
Points
0
I have saved all the comparison data. Give me the new ones, Dave, and I'll implement the plots! :yh:

Franco, quick question.. When making the Po/Pe and Efficiency plots, what kind of Excel chart do you use?

Do you select the usual "Line" or "Smoothed Line" chart type, or the "XY Scatter" chart type?
 
Joined
May 14, 2008
Messages
468
Points
0
Sorry for the delay, I was looking at a movie...
The XY Scatter, then the "point to point" line, then "Serie"....:yh:

Franco, quick question.. When making the Po/Pe and Efficiency plots, what kind of Excel chart do you use?

Do you select the usual "Line" or "Smoothed Line" chart type, or the "XY Scatter" chart type?
 
Last edited:

IgorT

0
Joined
Oct 24, 2007
Messages
4,177
Points
0
I think the efficiency level between 100 and 150ma denotes some significant diode improvements.


None of the 8X diodes approach that efficiency level.

I don't think that's correct, Larry. If you look better at my 8x vs. 12x comparison plots, you'll see that two of the 8x's exceed the second 12x in efficiency and one of the 8x's exceeds the first 12x in efficiency.


The behavior with the strange peak in efficienncy at around 100mA with 12x #1 would be abnormal and a hint that something about the diode is different, if it wasn't most likelly just a measurement error (with the first diode Dave said he wasn't very accurate).

If this was a special characteristic of these diodes, it would repeat itself with the second one, but it didn't. The second 12x does not display a peak like that, and the only reason one of the points in the 12x #2 plot goes above 8x #2 in efficiency is, that it has a data point there, while the 8x doesn't...

There is a short part, where it seems as if the 12x's have a better efficiency (where they form a "peak", and go above the 8x's, before plunging below them), but that is because Dave measured those 12x's at different steps than i measured the 8x's...

I used 40, 80, 120mA and so on, Dave used 60, 100, 150mA.. As a result, Excel has data points available for 12x's, where there is no data for 8x's and vice versa... These data points are then connected with straight (or smoothed) lines, which can then cross, because there is data in between missing...


Even if 12x's ACTUALLY behaved in this manner - which would be completelly atipical for 405nm diodes - i don't think any real conclusions can be made, until both diode types are compared using the same testing method - same setup, same step size (or accurate higher resolution plots)....

I'm not saying they don't behave like this (altho it would be weird, if they did, because i would indicate poor thermal stability), i'm saying, that the data is not accurate enough to answer this question.


Like i mentioned before - Low resolution testing is more than good enough for P/I (and even Po/Pe) plots which form straight (or nearly straight) lines anyway, but efficiency plots would benefit from a higher resolution...

If not that, at the very least they have to be compared using the same method, to allow real comparison...


Don't get me wrong, i was also surprised at the stange efficiency behavior when i first saw it, but i later edited my post, when i realized there is another possible explanation.


There are a few things that play a big factor here..

Dave is using a Rkcstr driver to make plots... When he turns the pot, the current changes exponentially. The higher he goes, the faster the current changes, and the longer it takes him to dial in a specific one - it's also easier to miss the desired current and make a mistake...

Also, in another thread Dave mentioned, he is without his big test heatsink (which was the same as i use - made by Tallaxo).

This, and the fact that it is harder for him to dial in a specific current means the diode probably warms up faster AND has more time to do so....

That would explain why the 12x's are dropping in efficiency so rapidly at higher currents! They would have to warm up considerably for that, but i guess that's what happened, because i can't believe that IF they are higher power diodes, they would be more sensitive to heat than 8x's!


Again, i'm not saying they are not new higher power diodes, i'm just saying the plots we used for comparison here are simply not good enough....


I do still think the 12X will last a lot longer @ 400mw or higher.
Sharp and Sony both have 320mw laser diodes in production for 12X ...

I think they are 320mw diodes ...
vs. 250mw for the 8X.
LarryDFW

I would love nothing more but for that to be true, and it's still possible, as PullBangDead explained!

But we will have to make better, more accurate tests, because there are too many differences between how the existing tests were done...


This is a big part of the reason PullBangDead keeps saying we should establish a testing protocol people should use, if they want their data to be useful for comparison of various diodes.


And i have an idea...

I still need to test it, but if it works, it would allow anyone with two DMMs and $15 - 25 USD to make a setup that would work the same way as my Diode Analyzer - one pot to set the max current, the other to adjust it LINEARLY from zero to max without the danger of overshooting... It makes plotting a hell of a lot easier!

If it works, i'll post a thread on how to do it, as soon as i find some time...

I just need to test if the required driver is stable enough. If it is, it will work...


P.S. Before i even finished typing this, i soldered one of the drivers required together.

I have to test it on a dummy to see if it can keep the current stable, find the right value pots, and if it works out, i'm sending it to Dave, so he can make plots easier, faster and more accurate at the same time... :yh:
 

daguin

0
Joined
Mar 29, 2008
Messages
15,989
Points
113
I tested the Pioneer 8X diode this evening. I tested it the same way I tested the 12X's and then I tested it going up at 60mA intervals. The first set of data is replicating the 12X test. The second set is to see if the interval is causing the strange curve.

Replicating 12X test

mA -- mW -- VF
60 -- 32 -- 3.95
100 -- 85 -- 4.38
150 -- 150 -- 4.77
200 -- 213 -- 5.01
250 -- 278 -- 5.20
300 -- 342 -- 5.34


Standardized intervals
mA -- mW -- VF
60 -- 32 -- 3.95
120 -- 112 -- 4.55
180 -- 189 -- 4.92
240 -- 266 -- 5.17
300 -- 342 -- 5.34

If FrancoRob plots both sets of data using the same formula in Excel, we can see if the strange curve is an artifact of the spreadsheet (and my measurement schema) or the diode.

Peace,
dave


Top