Jul 21, 2007 #1 R Revolvr 0 Joined Jul 4, 2007 Messages 36 Points 0 I created a chart for red and green lasers showing the laser price plotted against the price per mW. All of this data came from Marianne's table. Enjoy! -- Rev Attachments Price_per_mW_Chart.jpg 81.9 KB · Views: 2,956
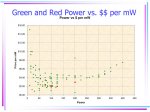
I created a chart for red and green lasers showing the laser price plotted against the price per mW. All of this data came from Marianne's table. Enjoy! -- Rev
Jul 22, 2007 #2 M marianne 0 Joined Jul 5, 2007 Messages 547 Points 0 hehe, nice! and that's a bloody huge amount of variation! perhaps you could do different coloured lines between the data points for matching companies/models? ie - blue for nova x-series, green for nova alpha, orange for laserglow...etc etc?
hehe, nice! and that's a bloody huge amount of variation! perhaps you could do different coloured lines between the data points for matching companies/models? ie - blue for nova x-series, green for nova alpha, orange for laserglow...etc etc?
Jul 22, 2007 #3 R Revolvr 0 Joined Jul 4, 2007 Messages 36 Points 0 Here is each company's line by power and price. This chart is for the whole product lines. these are GREEN only. Attachments PricePower_by_Co_All.jpg 83.2 KB · Views: 1,682
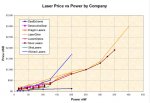
Here is each company's line by power and price. This chart is for the whole product lines. these are GREEN only.
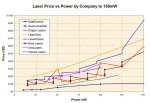
Jul 22, 2007 #4 R Revolvr 0 Joined Jul 4, 2007 Messages 36 Points 0 Here is the same chart but a close-up of the lasers up to 150mW. Attachments PricePower_by_Co_150.jpg 96.1 KB · Views: 3,087